Ground financial events
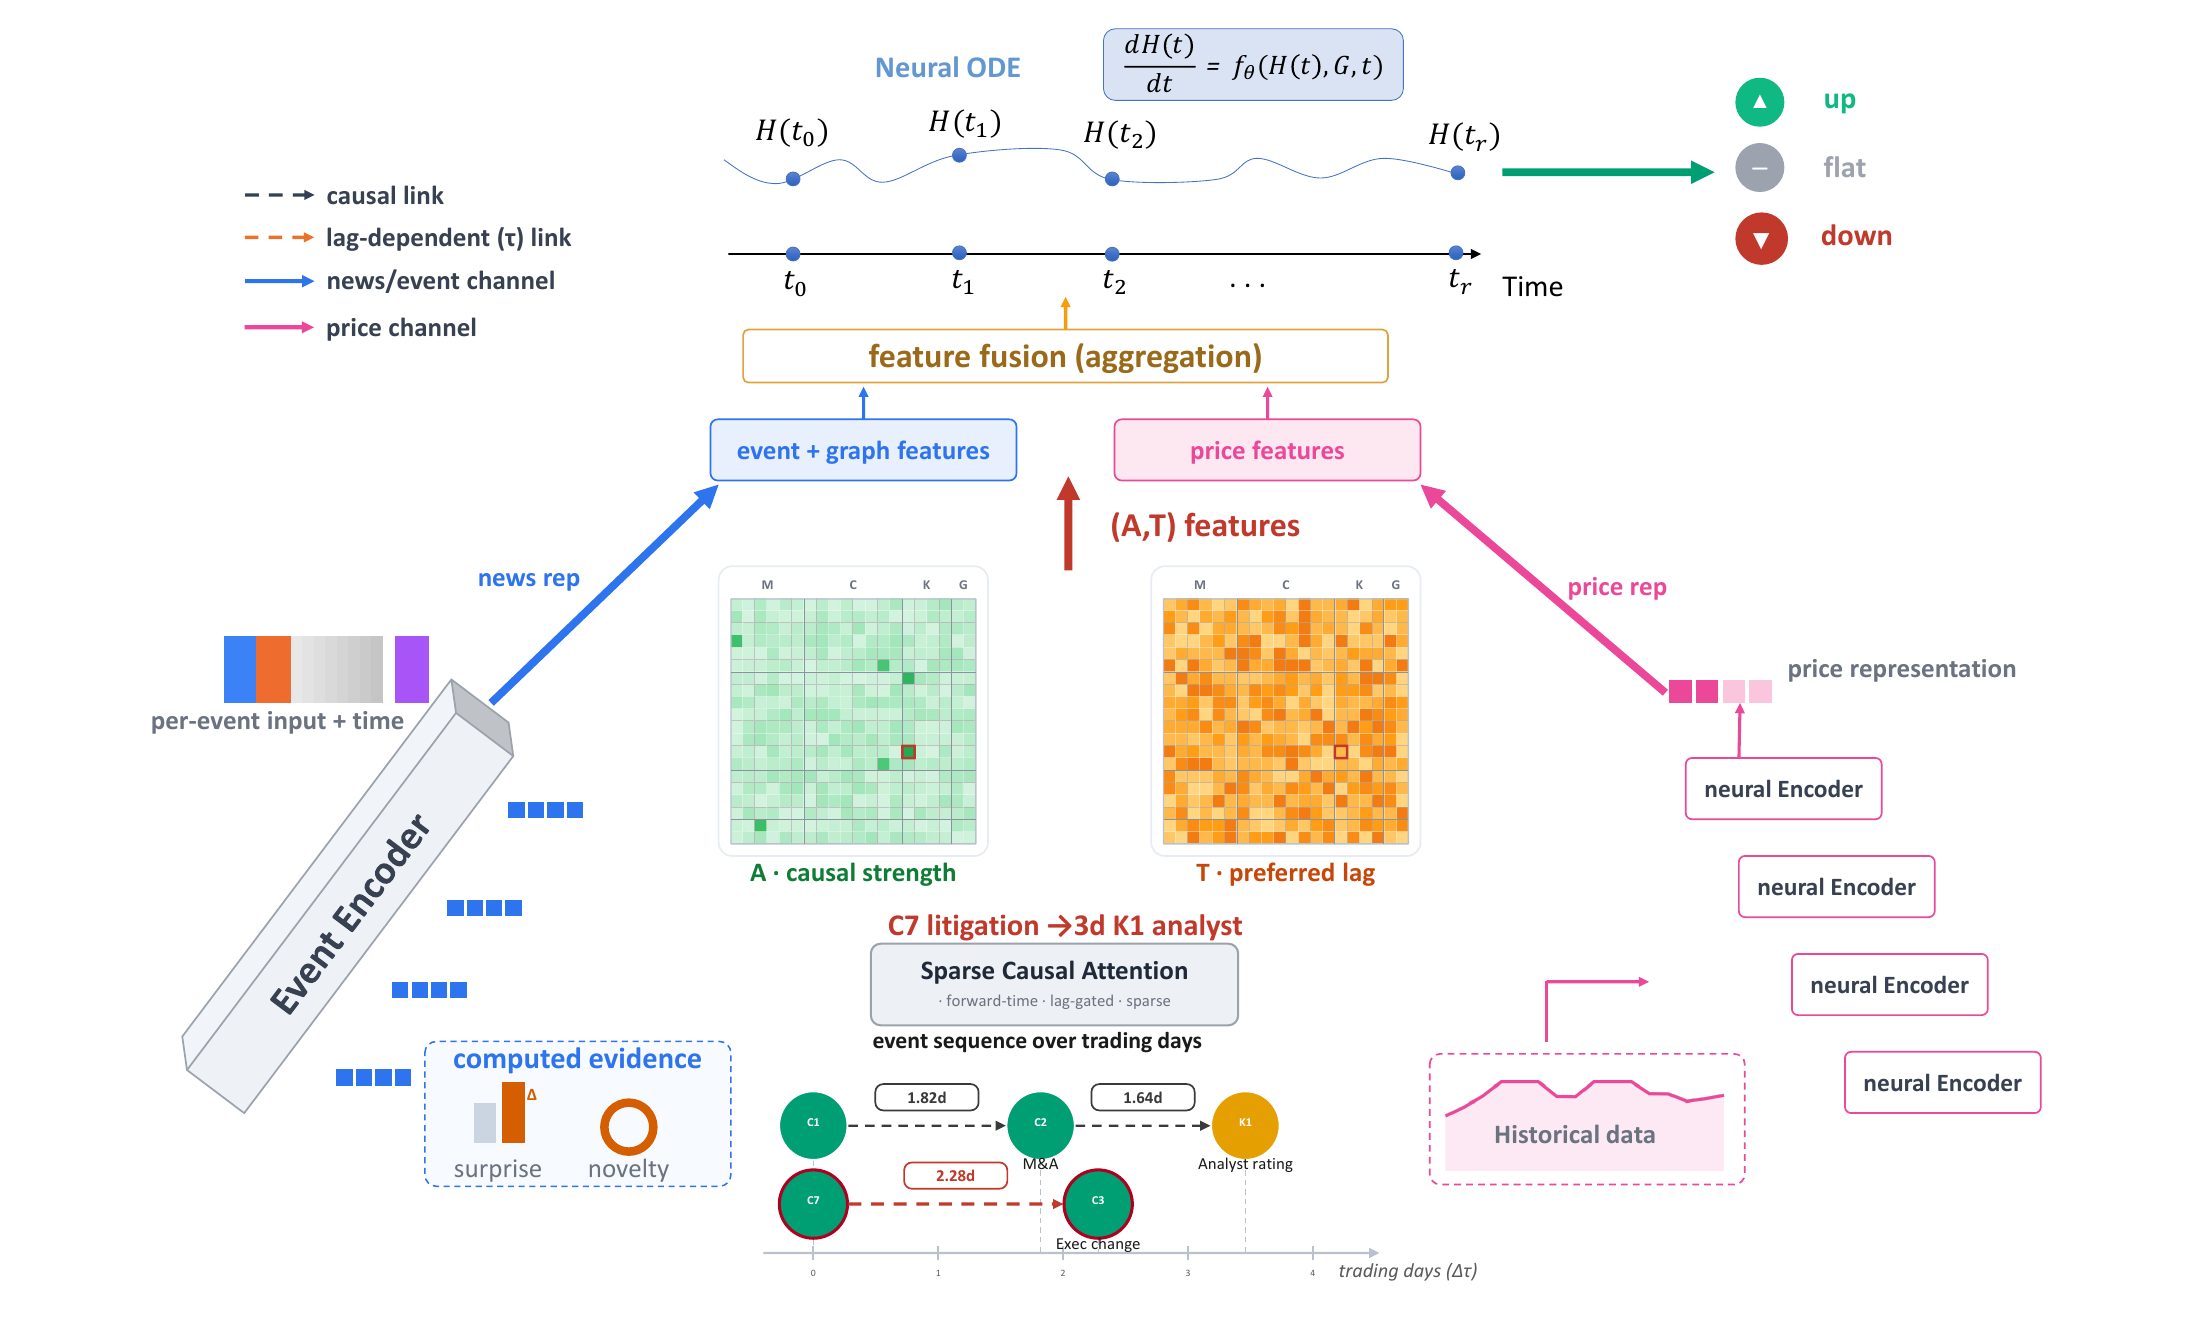
Schema-constrained LLM records identify event type, affected tickers and impact evidence. FinBERT embeddings, surprise and novelty connect text with market context.
Accepted · IEEE ICDM 2026
CausalLagStock
1 ShanghaiTech University2 Hong Kong Baptist University
* Equal contribution† Corresponding author
Additional implementation notes
CausalLagStock grounds financial news into structured events, learns a sparse global graph of event-type strengths and preferred trading-day delays, and reuses that graph in stock movement prediction and event monitoring.
01 / The research question
Financial news affects stock movements through delayed event pathways: an inflation report may later shape interest-rate expectations, while litigation news may precede governance changes or analyst reassessment. Existing news-driven predictors usually compress each item into sentiment, text embeddings, or stock-level relations, leaving no reusable representation of which financial event types tend to precede later event- or price-relevant signals and at what trading-day delays. We propose CausalLagStock, a lag-aware event-type propagation framework for predictive financial analysis. It grounds raw news into structured event records with event type, affected ticker, event-impact magnitude, surprise, and novelty evidence; learns a sparse global event-type propagation graph whose directed edges encode lagged predictive associations and preferred delays; and injects the learned graph into downstream predictors, including a graph-enhanced Neural ODE. Experiments on two aligned financial-news stock movement datasets show improved accuracy and weighted-F1 under chronological evaluation. The learned graph also exposes delayed pathways such as inflation-related news preceding interest-rate signals and litigation-related news preceding governance changes, making it useful as an inspectable monitoring layer while balanced prediction of threshold-sensitive minority classes remains challenging.
02 / A reusable event-type layer
Schema-constrained LLM records identify event type, affected tickers and impact evidence. FinBERT embeddings, surprise and novelty connect text with market context.
A shared graph over 20 event types encodes directed strength A and preferred trading-day lag T. Sparse lag-aware attention learns from chronological supervision at 1, 3, 5, 10 and 15 days.
Graph-derived features support a transparent HGB classifier. A graph-enhanced Neural ODE combines delayed event propagation with price histories for next-day Up / Down / Flat prediction.
The graph summarizes temporally ordered predictive associations between financial event types, supporting inspectable monitoring and horizon-aware analysis.
03 / Chronological evaluation
Results from the paper on FNSPID and CMIN-US. Examples are grouped by timestamp and purged at label-end boundaries. Direction labels use ±0.5% return thresholds.
| Dataset | Model | Seeds | Accuracy | Macro-F1 | Weighted-F1 | MCC |
|---|---|---|---|---|---|---|
| CMIN | StockNet | 3 | 0.3667 ± 0.0186 | 0.1795 ± 0.0055 | 0.1978 ± 0.0157 | −0.0014 ± 0.0025 |
| CMIN | Causality-driven Transformer | 3 | 0.3448 ± 0.0037 | 0.3436 ± 0.0036 | 0.3435 ± 0.0037 | 0.0175 ± 0.0025 |
| CMIN | CausalLagStock + Neural ODE | 5 | 0.4246 ± 0.0298 | 0.3172 ± 0.0131 | 0.4009 ± 0.0122 | 0.0075 ± 0.0243 |
| FNSPID | StockNet | 3 | 0.3689 ± 0.0177 | 0.2236 ± 0.0522 | 0.2509 ± 0.0682 | −0.0072 ± 0.0092 |
| FNSPID | Causality-driven Transformer | 3 | 0.3577 ± 0.0009 | 0.3559 ± 0.0008 | 0.3579 ± 0.0013 | 0.0368 ± 0.0008 |
| FNSPID | CausalLagStock + Neural ODE | 5 | 0.4939 ± 0.0131 | 0.3513 ± 0.0236 | 0.4698 ± 0.0192 | 0.0511 ± 0.0313 |
Results are reported over five seeds for CausalLagStock and three runs for the baselines.
Accuracy and weighted-F1 improve on both datasets. On CMIN, the full graph reaches 0.4246 accuracy versus 0.4093 without the graph and 0.4096 with a randomized graph.
Macro-F1 and MCC gains are not uniform. The minority Flat class remains difficult. On CMIN, HGB offers higher Macro-F1 (0.3319) than the Neural ODE (0.3172), with lower accuracy (0.4089).
04 / Inspectable monitoring patterns
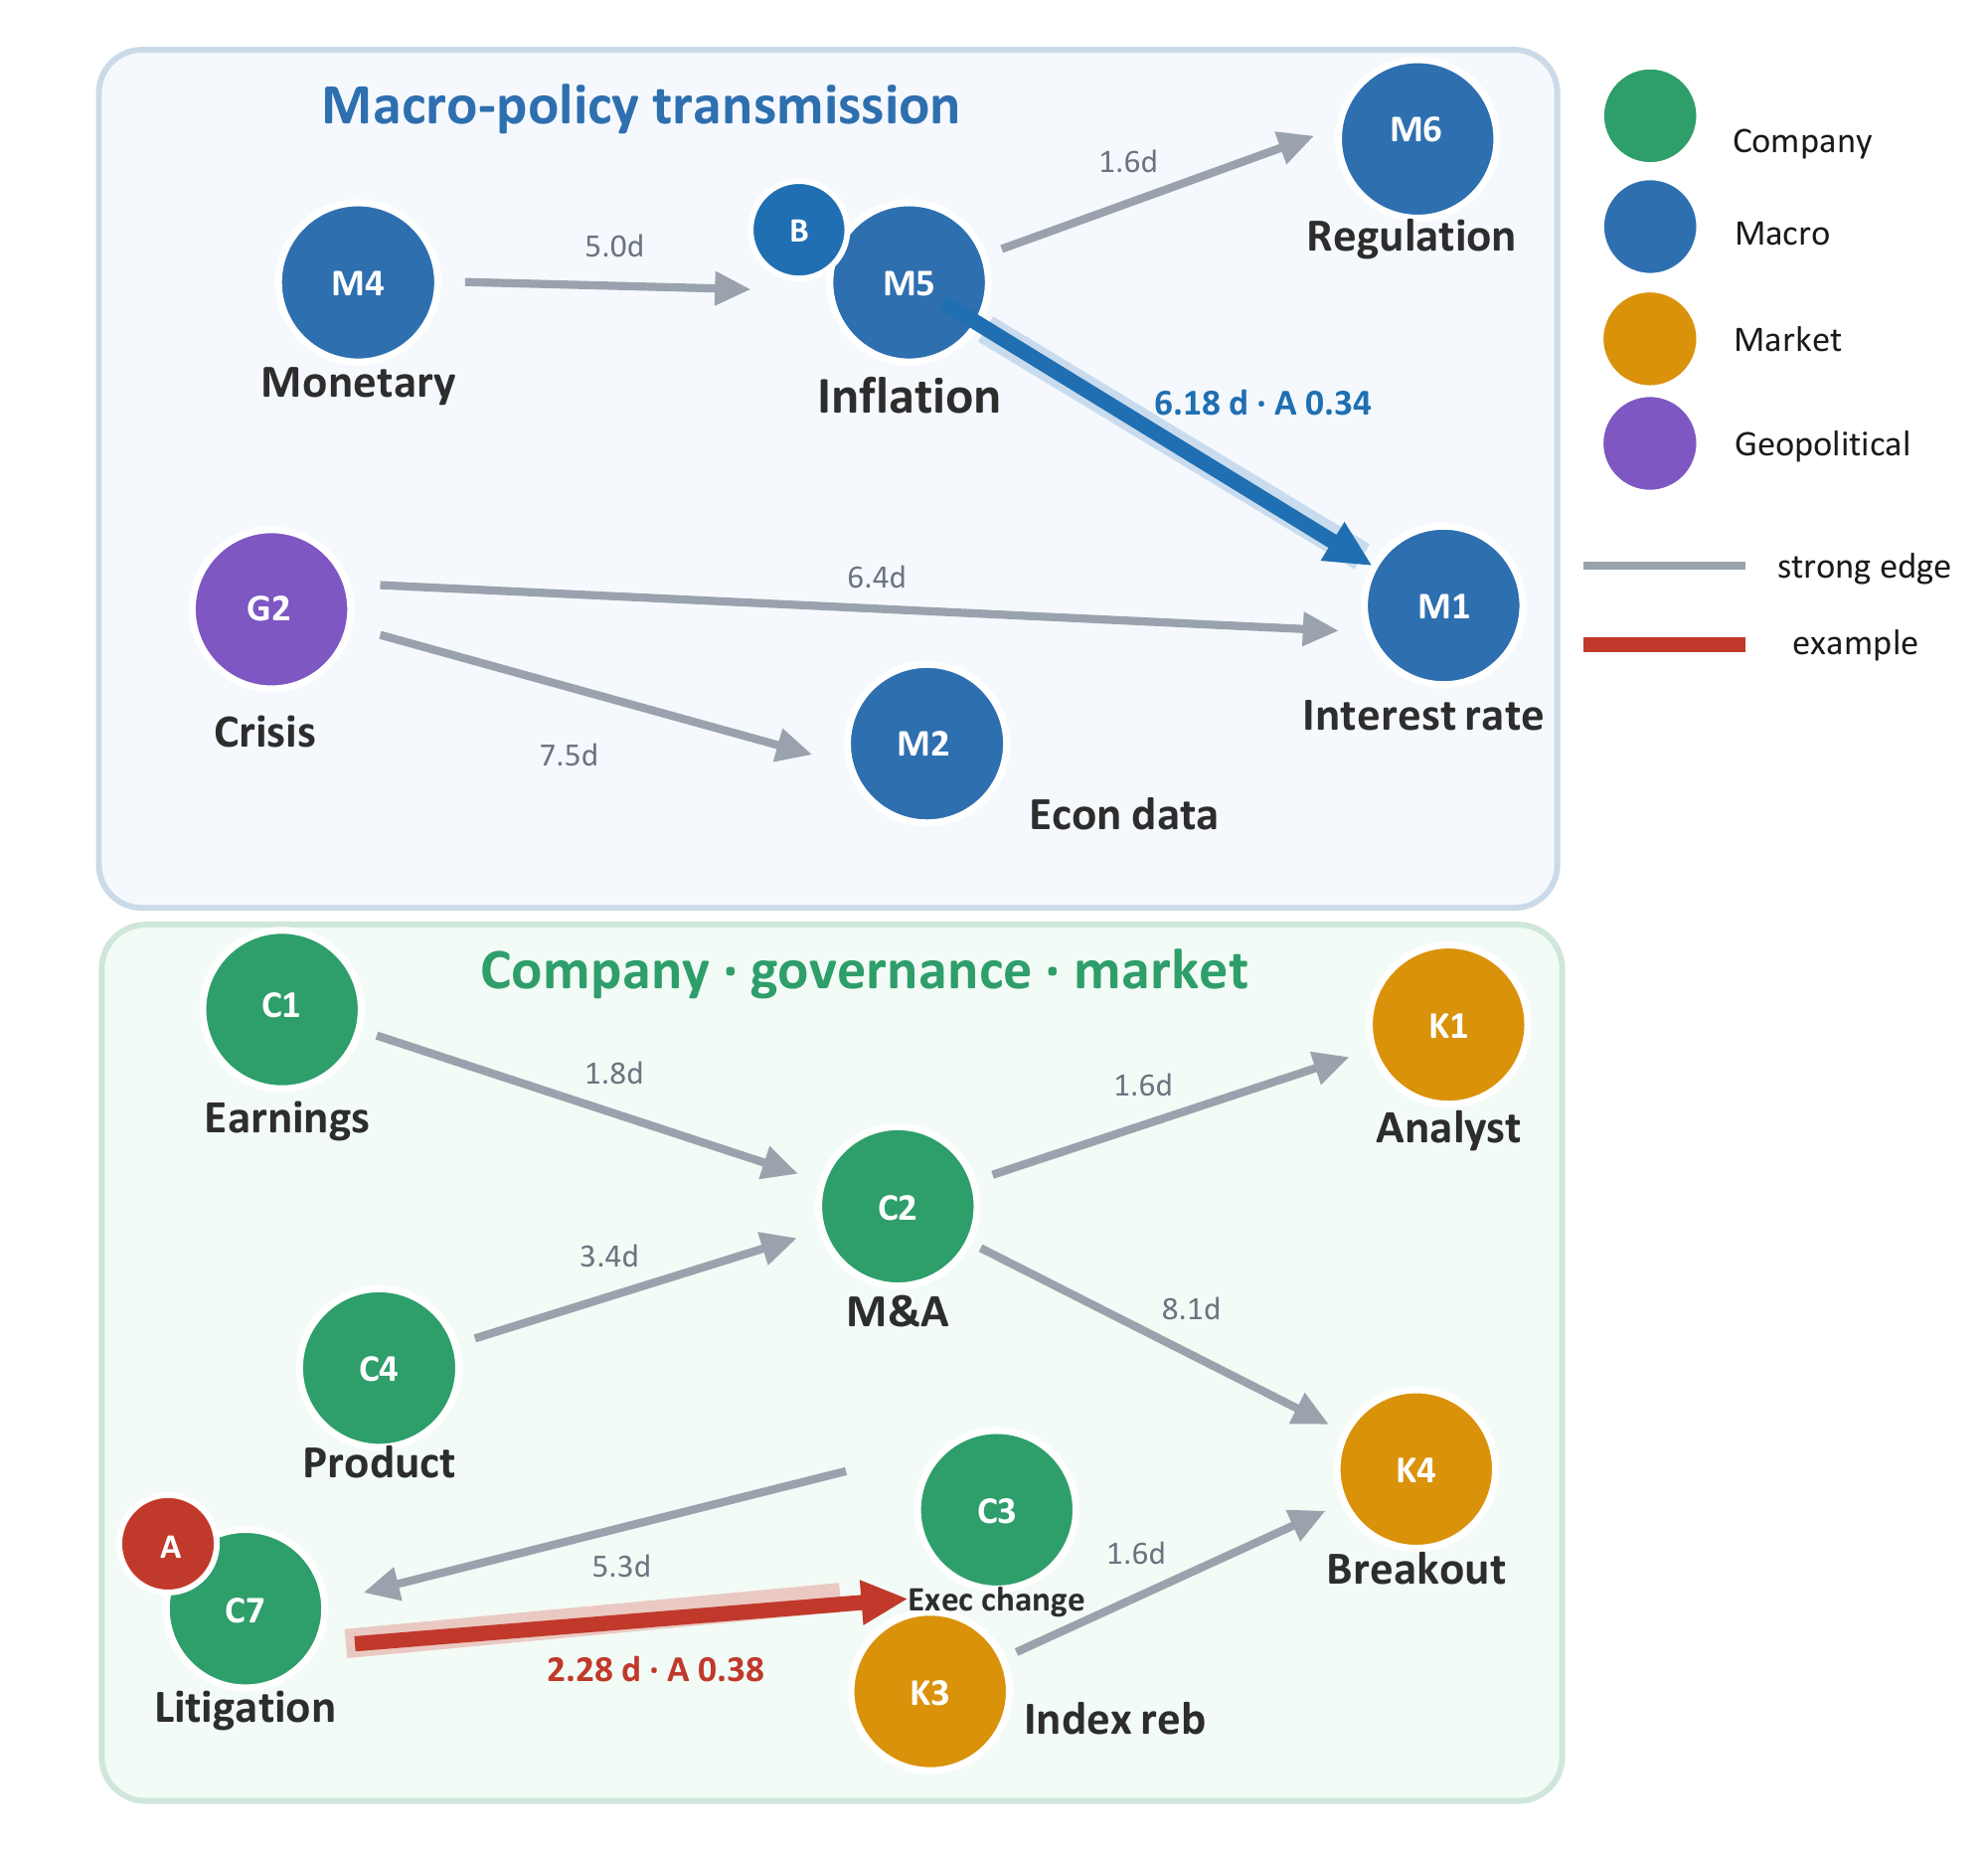
M5 → M1
6.18 trading days
Strength A = 0.3447. Inflation-related news precedes later rate-related signals over a multi-day monitoring window.
C7 → C3
2.28 trading days
Strength A = 0.3786. Legal-risk news precedes governance-related signals over a shorter monitoring window.
These learned pathways expose monitoring windows following macroeconomic and company events.
05 / Cite this work
Citation for the accepted paper (provisional proceedings metadata).
@inproceedings{li2026causallagstock,
  title = {Event-Type Propagation Graphs: A Lag-Aware Layer for Predictive Financial Analysis},
  author = {Li, Yuxuan and Zhang, Bohan and Yu, Guo and Gao, Ye and Zhang, Haipeng and Zhou, Yixi},
  booktitle = {2026 IEEE International Conference on Data Mining (ICDM)},
  year = {2026},
  address = {Shenyang, China},
  url = {https://github.com/XanderZhou2022/ICDM2026_CausalLagStock/blob/main/assets/paper.pdf},
  note = {Accepted; provisional citation pending official proceedings}
}